

Sales Data Plotter Lite
Μια απλή εφαρμογή Android για τη δημιουργία πολύχρωμων γραφημάτων των δεδομένων που σχετίζονται με τις πωλήσεις.
Πληροφορίες Εφαρμογής
Περιγραφή Εφαρμογής
Ανάλυση Εφαρμογών Android: Sales Data Plotter Lite, Που Αναπτύχθηκε Από Το ABHIJIT PODDAR. Που Αναφέρονται Στην Κατηγορία Παραγωγικότητα. Η Τρέχουσα Έκδοση Είναι 2.2, Ενημερωμένη Στις 17/10/2018 . Σύμφωνα Με Τις Αναθεωρήσεις Των Χρηστών Στο Google Play: Sales Data Plotter Lite. Επιτυγχάνονται Πάνω Από 6 Χίλια Εγκαταστάσεις. Το Sales Data Plotter Lite Έχει Σήμερα 37 Κριτικές, Μέση Βαθμολογία 3.9 Αστέρια
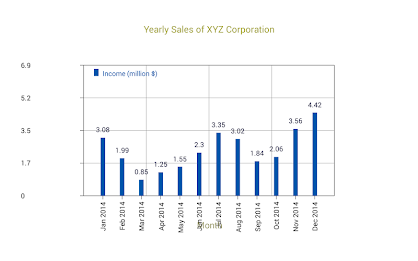
Μπορείτε να χρησιμοποιήσετε την εφαρμογή για να σχεδιάσετε τα δεδομένα σας ως γραμμικά ή γραφήματα γραμμώνπαραδείγματα γραφημάτων που μπορείτε να σχεδιάσετε:-
}}}}}}#}}#}}}#}} συγκεκριμένη ημέρα, μήνα, τρίμηνο ή έτος
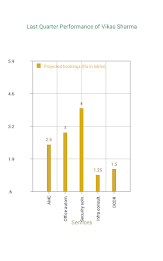
μεμονωμένα στοιχεία πωλήσεων ενός εκτελεστικού πωλήσεων για διαφορετικές ημέρες σε μια εβδομάδα, για διαφορετικές ημέρες σε ένα μήνα, για διαφορετικούς μήνες σε ένα χρόνο, για διαφορετικά τρίμηνα σε ένα χρόνο ή για αυτό το θέμα, για διαφορετικά χρόνια. Μπορείτε επίσης να συγκρίνετε τα δεδομένα σας με ένα άλλο σετ. Για παράδειγμα, μπορείτε να συγκρίνετε τις πραγματικές πωλήσεις διαφορετικών προϊόντων σε ένα τέταρτο με τους προκαθορισμένους στόχους για το ίδιο τρίμηνο. :-
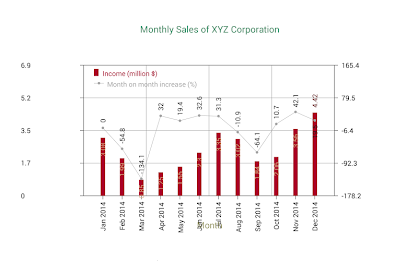
Χρησιμοποιήστε έναν δευτερεύοντα άξονα y για να συγκρίνετε τα αρχικά δεδομένα. Αυτό απαιτείται εάν τα δύο σύνολα y-data είναι διαφορετικής φύσης ή έχουν διαφορετικό εύρος τιμών. Για παράδειγμα, η αποτελεσματικότητα μιας διαφημιστικής εκστρατείας για την πώληση ενός προϊόντος μπορεί να μελετηθεί με την σχεδίαση των στοιχείων πωλήσεων διαφορετικών πωλήσεων πριν από την εκστρατεία χρησιμοποιώντας τον αρχικό άξονα y και σχεδιάζοντας την ποσοστιαία αύξηση ή μείωση των αντίστοιχων πωλήσεων μετά την εκστρατεία χρησιμοποιώντας τον δευτερεύοντα άξονα y.
Εκτελέστε απλά στατιστικά στοιχεία σχετικά με τα δεδομένα πωλήσεων για να βρείτε τις συνολικές πωλήσεις, τις μέσες πωλήσεις, την τυπική απόκλιση από το μέσο και πολλά άλλα. Τα στατιστικά στοιχεία θα μπορούσαν, για παράδειγμα, να βοηθήσουν να επισημάνουν την αποτελεσματικότητα μιας διαφημιστικής εκστρατείας στις πωλήσεις. Μπορούν να εμφανιστούν και στον καμβά γραφήματος. Αυτό αποδεικνύεται πολύ χρήσιμο καθώς ο αριθμός των σειρών των δεδομένων αυξάνεται. συνάδελφος από την ίδια την εφαρμογή. abhijit poddar
dept. του ηλεκτρονικού sc.
Surendranath Evening College
Kolkata 700009 Ινδία
και MS. MONALI PODDAR
Τμήμα. του Computer Sc.
Maharaja Manindra Chandra College
Kolkata 700003 Ινδία
Προσφέρουμε Επί Του Παρόντος Την Έκδοση 2.2. Αυτή Είναι Η Τελευταία, Πιο Βελτιστοποιημένη Έκδοση Μας. Είναι Κατάλληλο Για Πολλές Διαφορετικές Συσκευές. Δωρεάν Λήψη Απευθείας Apk Από Το Google Play Store Ή Άλλες Εκδόσεις Που Φιλοξενούμε. Επιπλέον, Μπορείτε Να Κατεβάσετε Χωρίς Εγγραφή Και Δεν Απαιτείται Σύνδεση.
Έχουμε Περισσότερες Από 2000+ Διαθέσιμες Συσκευές Για Samsung, Xiaomi, Huawei, Oppo, Vivo, Motorola, LG, Google, OnePlus, Sony, Tablet ... Με Τόσες Πολλές Επιλογές, Είναι Εύκολο Για Εσάς Να Επιλέξετε Παιχνίδια Ή Λογισμικό Που Ταιριάζουν Στη Συσκευή Σας.
Μπορεί Να Έρθει Χρήσιμο Εάν Υπάρχουν Περιορισμοί Χώρας Ή Περιορισμοί Από Την Πλευρά Της Συσκευής Σας Στο Google App Store.
Τι Νέο Υπάρχει
Bugs removed
Βαθμολογία Και Αναθεώρηση Στο Κατάστημα Google Play
Συνολικός Αριθμός Εγκαταστάσεων (*Εκτιμώμενη)
Εκτίμηση Του Συνολικού Αριθμού Εγκαταστάσεων Στο Google Play, Προσεγγίζεται Από Τον Αριθμό Των Αξιολογήσεων Και Την Εγκατάσταση Ορίων Που Επιτεύχθηκαν Στο Google Play.Μπορεί Επίσης Να Σας Αρέσουν Αυτές Οι Εφαρμογές


Discover Apps

- Chatbot - AI Smart Assistant

- ChatOn - AI Chat Bot Assistant

- AI Chat - Assistant & Chatbot

- TV Cast for Chromecast - TVCST

- Deep Think - AI Seek Chatbot

- AppLock - Fingerprint App Lock

- AI Chatbot: Pixi

- DeepSeek - AI Chatbot

- Perplexity - Ask Anything

- Inscope - AI Search & Browser

- AI Μεταγραφή Φωνής σε Κείμενο

- Vetted AI: Your Shopping Agent

Δημοφιλείς Εφαρμογές


Δημοφιλείς Νέες Εφαρμογές
- Chatbot - AI Smart Assistant
- Perplexity - Ask Anything
- AI Μεταγραφή Φωνής σε Κείμενο
- Grok - AI Assistant
- WPS Office-PDF,Word,Sheet,PPT
- Adobe Acrobat Reader: Edit PDF
- OtterAI Transcribe Voice Notes

- Claude by Anthropic
- Any.do - Εργασίες + Ημερολόγιο

- Επαγγελματικό Ημερολόγιο
- AVG Cleaner – Καθαρισμός

- BEEP - Expiry Date Tracking
