

Sales Data Plotter Lite
화려한 판매 관련 데이터 그래프를 만들기위한 간단한 안드로이드 앱.
앱 정보
앱 설명
Android 앱 분석 및 검토 : Sales Data Plotter Lite, ABHIJIT PODDAR에서 개발했습니다. 생산성 카테고리에 나열되어 있습니다. 현재 버전은 2.2이며 17/10/2018 에 업데이트되었습니다. Google Play : Sales Data Plotter Lite에서 사용자 리뷰에 따르면. 6 천 이상의 설치를 달성했습니다. Sales Data Plotter Lite는 현재 37 리뷰, 평균 등급 3.9 스타를 보유하고 있습니다
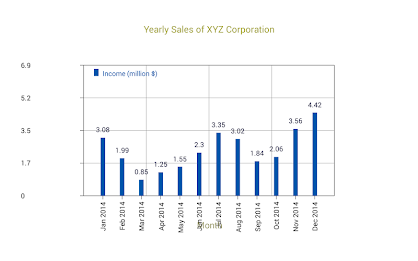
앱을 사용하여 데이터를 라인 또는 막대 그래프로 플로팅 할 수 있습니다.플롯 할 수있는 그래프의 예 :-
일주일 동안 다른 날, 한 달에 다른 날, 1 년 동안, 다른 해의 다른 분기 또는 다른 해에 대해 다른 일에 대해 다른 날에 대해 다른 날에 다른 날에 대한 특정 제품 또는 서비스에 대한 판매 수치. 일, 월, 분기 또는 연도.
일주일 동안 다른 날, 한 달에 다른 날, 1 년에 다른 몇 달, 1 년 동안 다른 분기 또는 해당 문제에 대해 다른 날, 다른 해,
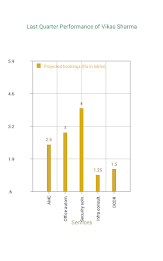
특정 일, 월, 1/4, 연도에 최대 31 명의 영업 경영자의 개별 판매 수치의 개별 판매 수치. 데이터를 다른 세트와 비교할 수도 있습니다. 예를 들어, 4 분의 1의 다른 제품의 실제 판매를 같은 분기에 규정 된 대상과 비교할 수 있습니다.
자세한 내용은 '판매 데이터 플로터'웹 사이트
www.android-apps.abhipod.com/salesdataplotter/. (
를 방문하십시오.
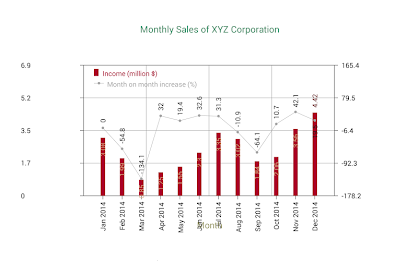
보조 y 축을 사용하여 원래 데이터를 비교하십시오. 두 세트의 y-data 세트가 다른 특성이 있거나 다른 값 범위를 갖는 경우에 필요합니다. 예를 들어, 제품 판매에 대한 홍보 캠페인의 효과는 원래 Y 축을 사용하여 캠페인 전에 다른 영업 담당자의 판매 수치를 플로팅하고 2 차 Y 축을 사용한 캠페인 후 캠페인 후에 해당 판매의 백분율 증가 또는 감소를 플로팅하여 연구 할 수 있습니다.
판매 데이터에 대한 간단한 통계를 수행하여 총 판매, 평균 판매, 평균의 표준 편차 등을 찾습니다. 예를 들어, 통계는 판매에 대한 홍보 캠페인의 효과를 지적하는 데 도움이 될 수 있습니다. 그래프 캔버스에도 표시 될 수 있습니다.
그래프 캔버스를 다른 크기로 확대하여 그래프를 더 자세히 볼 수 있습니다. 이것은 데이터 행의 수가 증가함에 따라 매우 도움이됩니다.
전체 크기의 용지에 인쇄물을 가져 오거나 LCD 프로젝트에 인쇄물을 표시하기 위해
고해상도 온 스크린 그래프 이미지 (원래 또는 확대 크기)와 함께 전화 메모리 또는 SD 카드에 대한 모든 데이터를 저장하거나 컴퓨터 화면에 또는 LCD 프로젝터를 표시하기 위해
}}}}}#}
}
} 앱 자체 내에서 동료.
설치되면 앱을 사용하지 않는 한 '판매 데이터 플로터'웹 사이트를 방문하지 않으면 인터넷에 연결되어 있지 않아도됩니다.
앱은 다음과 같이 작성되었습니다. Abhijit Poddar
부서. 전자 Sc.
Surendranath Evening College
Kolkata 700009 India
및 MS. Monali Poddar
부서. Computer Sc.
Maharaja Manindra Chandra College
Kolkata 700003 India
우리는 현재 버전 2.2를 제공하고 있습니다. 이것은 우리의 최신 버전입니다. 다양한 장치에 적합합니다. Google Play 스토어 또는 우리가 호스팅하는 기타 버전에서 직접 Apk를 무료로 다운로드하십시오. 또한 등록없이 다운로드 할 수 있으며 로그인이 필요하지 않습니다.
옵션이 많은 Samsung, Xiaomi, Huawei, Oppo, Vivo, Motorola, LG, Google, OnePlus, Sony, Tablet ... 용 2000+ 이상의 장치가 있으며 장치에 맞는 게임이나 소프트웨어를 쉽게 선택할 수 있습니다.
Google App Store의 국가 제한이나 장치 측면에서 제한 사항이 있으면 유용 할 수 있습니다.
새로운 것
Bugs removed


