

Sales Data Plotter Lite
Vienkārša Android lietotne, lai izveidotu krāsainus ar pārdošanu saistīto datu grafikus.
Informācija Par Lietotni
Lietotnes Apraksts
Android Lietotņu Analīze Un Pārskats: Sales Data Plotter Lite, Izstrādājusi ABHIJIT PODDAR. Uzskaitīts Produktivitāte Kategorijā. Pašreizējā Versija Ir 2.2, Atjaunināta 11.-22. Saskaņā Ar Lietotāju Pārskatiem Vietnē Google Play: Sales Data Plotter Lite. Sasniegts Vairāk Nekā 6 Tūkstoš Instalācijas. Sales Data Plotter Lite Pašlaik Ir 37 Atsauksmes, Vidējais Vērtējums 3.9 Zvaigznes
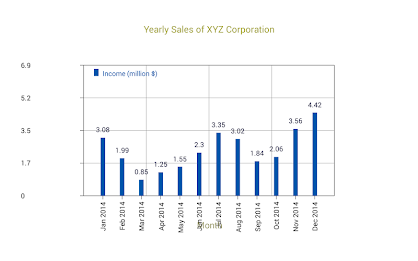
Jūs varat izmantot lietotni, lai attēlotu savus datus kā līnijas vai joslu diagrammas.Grafiku piemēri, kurus varat uzzīmēt:-
pārdošanas rādītāji konkrētam produktam vai pakalpojumam dažādām dienām nedēļā, dažādiem dienām, dažādiem gadiem, {#########{###pārdošanas apjomiem dažādiem gadiem. Diena, mēnesis, ceturksnis vai gads.
Pārdošanas vadītāja individuālie pārdošanas rādītāji dažādās dienās nedēļā, dažādās dienās mēnesī, dažādiem mēnešiem gadā, dažādiem ceturkšņiem gadā vai šajā jautājumā, dažādiem gadiem.
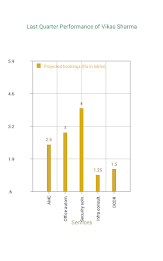
individuālie pārdošanas rādītāji līdz 31 pārdošanas izpildi noteiktā dienā, mēnesī, ceturksnī. Jūs varat arī salīdzināt savus datus ar citu komplektu. Piemēram, jūs varat salīdzināt dažādu produktu faktisko pārdošanas apjomus ceturksnī ar noteiktajiem mērķiem tajā pašā ceturksnī.
Lai iegūtu papildinformāciju, apmeklējiet vietni “pārdošanas datu plotētājs” vietnē
www.android-apps.abhipod.com/salesdataplotter /.
’’ pārdošanas datu datu datu. :-
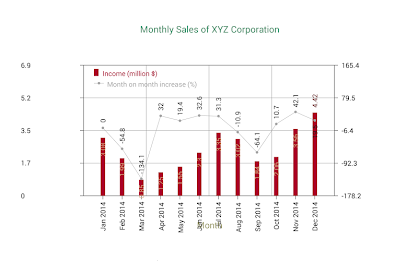
Izmantojiet sekundāro y asi, lai salīdzinātu sākotnējos datus. Tas ir nepieciešams, ja abiem Y-datu kopām ir atšķirīgs raksturs vai ir atšķirīgs vērtību diapazons. Piemēram, reklāmas kampaņas efektivitāti par produkta pārdošanu var izpētīt, pirms kampaņas, izmantojot sākotnējo y asi, uzzīmējot dažādu pārdošanas personāla pārdošanas rādītājus, un, izmantojot kampaņu, izmantojot sekundāro Y asi, nosakot procentuālo pieaugumu vai samazinājumu atbilstošajā pārdošanas apjomā.
Veiciet vienkāršu statistiku par pārdošanas datiem, lai atrastu kopējo pārdošanas apjomu, vidējo pārdošanas apjomus, standartnovirzi no vidējā un vairāk. Piemēram, statistika varētu palīdzēt norādīt uz reklāmas kampaņas efektivitāti pārdošanas apjomos. Tie var tikt parādīti arī uz grafika audekla.
tuviniet diagrammas audeklu dažādos izmēros, lai varētu sīkāk apskatīt grafiku. Tas izrādās ļoti noderīgi, palielinoties datu skaitam. Kolēģis no pašas lietotnes. Abhijit Poddar
departaments. no elektroniskās sc.
Surendranath vakara koledžas
Kolkata 700009 Indija
un MS. Monali Poddar
departaments. dators sc.
Maharaja Manindra Chandra koledža
Kolkata 700003 Indija
Pašlaik Mēs Piedāvājam 2.2 Versiju. Šī Ir Mūsu Jaunākā, Optimizētākā Versija. Tas Ir Piemērots Daudzām Dažādām Ierīcēm. Bezmaksas Lejupielāde Tieši Apk No Google Play Veikala Vai Citām Versijām, Kuras Mēs Mitinām. Turklāt Jūs Varat Lejupielādēt Bez Reģistrācijas Un Nav Nepieciešama Pieteikšanās.
Mums Ir Vairāk Nekā 2000+ Pieejamās Ierīces Samsung, Xiaomi, Huawei, Oppo, Vivo, Motorola, LG, Google, OnePlus, Sony, Tablet ... Ar Tik Daudzām Iespējām, Jums Ir Viegli Izvēlēties Spēles Vai Programmatūru, Kas Atbilst Jūsu Ierīcei.
Tas Var Noderēt, Ja Ir Kādi Valsts Ierobežojumi Vai Kādi Ierobežojumi No Jūsu Ierīces Puses Google App Store.
Kas Jauns
Bugs removed
Novērtējiet Un Pārskatiet Google Play Veikalā
Kopējais Instalāciju Skaits (*Aprēķināts)
Kopējais Instalāciju Skaita Novērtējums Google Play, Aptuvenā No Vērtējumu Skaita Un Instalējiet Robežas, Kas Sasniegta Google Play.


Discover Apps

- Chatbot - AI Smart Assistant

- ChatOn - AI Chat Bot Assistant

- 4o Chatbot AI Chat Assistant

- TV Cast for Chromecast - TVCST

- Deep Think - AI Seek Chatbot

- AppLock - Fingerprint App Lock

- AI Chatbot: Pixi

- DeepSeek, Grok - AskMyChat

- Perplexity - Ask Anything

- Inscope - AI Search & Browser

- AI Transcribe Speech to Text

- Vetted AI: Your Shopping Agent

Populāras Lietotnes


Populāras Jaunas Lietotnes
- ChatOn - AI Chat Bot Assistant
- TV Cast for Chromecast - TVCST
- Perplexity - Ask Anything
- Grok
- Visu Dokumentu Lasītājs
- Photo Translator- CamTranslate

- ChatBox: AI Chat Bot Assistant

- WPS Office-PDF,Word,Sheet,PPT
- Speechnotes - Speech To Text

- Adobe Acrobat Reader: Edit PDF
- OtterAI Transcribe Voice Notes

- Document Reader PDF Reader
