

Sales Data Plotter Lite
Jednoduchá aplikácia pre Android na vytváranie farebných grafov údajov súvisiacich s predajom.
Informácie
Advertisement
Popis Aplikácie
Analýza A Recenzia Aplikácií Pre Android: Sales Data Plotter Lite, Vyvinutý Spoločnosťou ABHIJIT PODDAR. Uvedené V Kategórii Kancelárske. Aktuálna Verzia Je 2.2, Aktualizovaná Na 17/10/2018 . Podľa Recenzií Používateľov V Službe Google Play: Sales Data Plotter Lite. Dosiahnuté Viac Ako Inštalácie 6 Tisíc. Sales Data Plotter Lite V Súčasnosti Má 37 Recenzií, Priemerné Hodnotenie 3.9 Hviezd
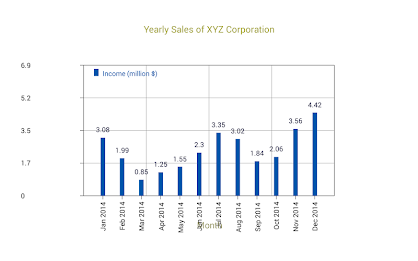
Aplikáciu môžete použiť na vykreslenie svojich údajov ako riadkových alebo stĺpcových grafov.Príklady grafov, ktoré môžete vykresliť:-
Obrázky pre konkrétny produkt alebo službu pre rôzne dni v týždni, za rôzne dni v rôznych mesiacoch v rôznych mesiacoch pre 31 rokov pre 31 rokov pre 31 rokov pre 31 rokov pre 31 rokov pre 31 rokov pre 31 rokov pre 31 rokov pre 31 rokov, pre rôzne štvrťroky v roku alebo v tejto veci, v tejto veci, pre rôzne roky. konkrétny deň, mesiac, štvrťrok alebo rok.
individuálne predajné údaje o predajcovi za rôzne dni v týždni, za rôzne dni v mesiaci, na rôzne mesiace v roku, pre rôzne štvrťroky v roku alebo v tomto záležitosti, po dobu rôznych rokov. Svoje údaje môžete tiež porovnávať s inou sadou. Napríklad môžete porovnávať skutočný predaj rôznych produktov v štvrťroku s predpísanými cieľmi v rovnakom štvrťroku.
, kde nájdete webovú stránku „predaja dátových plotter“ na adrese
www.android-apps.abhips.com/salesdataplotter/
{####}#}##}#}##}##}#################) :-
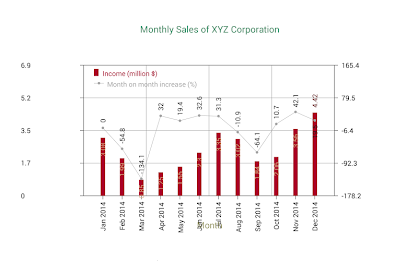
Pomocou sekundárnej Y na porovnanie pôvodných údajov. Vyžaduje sa to, ak sú dve sady Y-Data inej povahy alebo majú odlišný rozsah hodnôt. Napríklad účinnosť propagačnej kampane na predaj produktu sa môže študovať vykreslením predajných údajov rôznych predajných pracovníkov pred kampaňou pomocou pôvodnej osi Y a vykresľovaním percentuálneho zvýšenia alebo zníženia zodpovedajúceho predaja po kampani pomocou sekundárnej osi Y.
Vykonajte jednoduché štatistiky o predajných údajoch, aby ste našli celkový predaj, priemerný predaj, štandardnú odchýlku od priemeru a viac. Štatistiky by napríklad mohli pomôcť poukázať na efektívnosť propagačnej kampane o predaji. Môžu byť zobrazené aj na grafovom plátne. Ukázalo sa, že je veľmi užitočné, keď sa zvyšuje počet riadkov údajov. Kolega zvnútra samotná aplikácia.
Po nainštalovaní aplikácia nevyžaduje, aby zostala pripojená k internetu, pokiaľ ju nechcete použiť na návštevu webovej stránky „predaja údajov“. Abhijit Poddar
Dept. Electronic SC.
Surendranath Evening College
Kolkata 700009 India
a MS. Monali Poddar
Dept. počítača sc.
Maharaja Manindra Chandra College
Kolkata 700003 India
Momentálne Ponúkame Verziu 2.2. Toto Je Naša Najnovšia, Najviac Optimalizovaná Verzia. Je Vhodný Pre Mnoho Rôznych Zariadení. Bezplatné Stiahnutie Priamo Apk Z Obchodu Google Play Alebo Iných Verzií, Ktoré Hosťujeme. Okrem Toho Si Môžete Stiahnuť Bez Registrácie A Nevyžaduje Sa Žiadne Prihlásenie.
Máme Viac Ako 2000+ Dostupné Zariadenia Pre Samsung, Xiaomi, Huawei, Oppo, Vivo, Motorola, LG, Google, OnePlus, Sony, Tablet ... S Toľkými Možnosťami, Je Pre Vás Ľahké Zvoliť Si Hry Alebo Softvér, Ktoré Sa Zmestia Na Vaše Zariadenie.
Môže To Byť Užitočné, Ak V Obchode Google App Store Existujú Obmedzenia Krajiny Alebo Akékoľvek Obmedzenia Zo Strany Vášho Zariadenia.
Čo Je Nové
Bugs removed
Ohodnoťte A Skontrolujte V Obchode Google Play
Celkový Počet Inštalácií (*Odhadované)
Odhad Celkového Počtu Inštalácií Na Google Play, Približne Z Počtu Ratingov A Nainštalujte Hranice Dosiahnuté V Službe Google Play.


Discover Apps

- ChatOn - AI Chat Bot Assistant

- TV Cast for Chromecast - TVCST

- Zámok Aplikácie - Zámok Heslom

- Deep Search AI Seek AskMyChat

- PDF Scanner - Scan to PDF

- Perplexity - Ask Anything

- Vetted AI: Your Shopping Agent

- AI Voice Clone Voice Generator

- Grok - AI Assistant

- Alarm Clock: Alarm App & Sleep

- Document Reader & PDF Editor

- Vše-V-Jednom Kalkulačka

Populárne Aplikácie
- Perplexity - Ask Anything
- Grok - AI Assistant
- Document Reader & PDF Editor
- Čítačka Všetkých Dokumentov

- WPS Office-PDF,Word,Sheet,PPT

- Adobe Acrobat Reader: Edit PDF

- Aplikácia AI Chat - AI Chatbot

- Centrum všech dokumentů

- AI Chat V Slovenčine

- Cards - Mobilná peňaženka

- AI Chat: Ask AI Chat Anything

- Chatbot AI - Search Assistant

Populárne Nové Aplikácie
- ChatOn - AI Chat Bot Assistant
- Perplexity - Ask Anything
- Calendar Planner - Agenda App

- Forest: Focus for Productivity

- WPS Office-PDF,Word,Sheet,PPT
- GPT Chatbot AI - Genie

- Adobe Acrobat Reader: Edit PDF
- Claude by Anthropic

- AVG Cleaner: Čistič

- Cards - Mobilná peňaženka
- Chatbot AI - Search Assistant
- Listen AI: Text to Speech
