

Sales Data Plotter Lite
Một ứng dụng Android đơn giản để tạo các biểu đồ đầy màu sắc của dữ liệu liên quan đến bán hàng.
Thông Tin Ứng Dụng
Mô Tả Ứng Dụng
Phân Tích Và Đánh Giá Ứng Dụng Android: Sales Data Plotter Lite, Được Phát Triển Bởi ABHIJIT PODDAR. Được Liệt Kê Trong Danh Mục Năng Suất. Phiên Bản Hiện Tại Là 2.2, Được Cập Nhật Vào Ngày 17/10/2018 . Theo Đánh Giá Của Người Dùng Trên Google Play: Sales Data Plotter Lite. Đạt Được Hơn 6 Ngàn Cài Đặt. Sales Data Plotter Lite Hiện Có Đánh Giá 37, Xếp Hạng Trung Bình 3.9 Sao
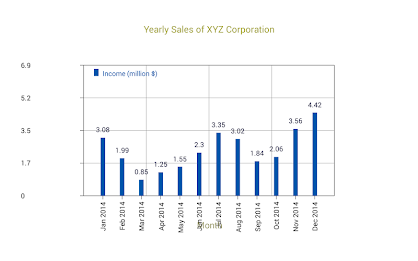
Bạn có thể sử dụng ứng dụng để vẽ dữ liệu của mình dưới dạng biểu đồ dòng hoặc thanh. Ngày, tháng, quý hoặc năm. Bạn cũng có thể so sánh dữ liệu của bạn với một bộ khác. Ví dụ: bạn có thể so sánh doanh số thực tế của các sản phẩm khác nhau trong một phần tư với các mục tiêu được quy định trong cùng một quý.Để biết thêm thông tin :-
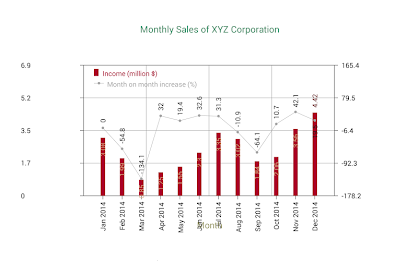
Sử dụng trục y thứ cấp để so sánh dữ liệu gốc. Điều này là bắt buộc nếu hai bộ dữ liệu y có tính chất khác nhau hoặc có phạm vi giá trị khác nhau. Ví dụ, hiệu quả của một chiến dịch quảng cáo về việc bán sản phẩm có thể được nghiên cứu bằng cách vẽ các số liệu bán hàng của nhân viên bán hàng khác nhau trước khi chiến dịch sử dụng trục Y gốc và vẽ phần trăm tăng hoặc giảm doanh số tương ứng sau chiến dịch sử dụng trục Y thứ cấp.
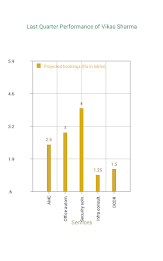
Thực hiện các số liệu thống kê đơn giản trên dữ liệu bán hàng để tìm tổng doanh số, doanh số trung bình, độ lệch chuẩn so với mức trung bình và hơn thế nữa. Ví dụ, các số liệu thống kê có thể giúp chỉ ra hiệu quả của một chiến dịch quảng cáo trên doanh số. Chúng cũng có thể được hiển thị trên khung vẽ biểu đồ. Điều này hóa ra rất hữu ích khi số lượng hàng dữ liệu tăng lên. Đồng nghiệp từ bên trong chính ứng dụng. Abhijit poddar
Dept. của điện tử sc.
Surendranath buổi tối đại học
Kolkata 700009 Ấn Độ
và MS. Monali Poddar
Phòng. của máy tính sc.
Maharaja Manindra Chandra College
Kolkata 700003 Ấn Độ
Chúng Tôi Hiện Đang Cung Cấp Phiên Bản 2.2. Đây Là Phiên Bản Mới Nhất, Được Tối Ưu Hóa Nhất Của Chúng Tôi. Nó Phù Hợp Cho Nhiều Thiết Bị Khác Nhau. Tải Xuống Miễn Phí Apk Trực Tiếp Từ Cửa Hàng Google Play Hoặc Các Phiên Bản Khác Mà Chúng Tôi Lưu Trữ. Hơn Nữa, Bạn Có Thể Tải Xuống Mà Không Cần Đăng Ký Và Không Cần Đăng Nhập.
Chúng Tôi Có Nhiều Thiết Bị Có Sẵn 2000+ Cho Samsung, Xiaomi, Huawei, Oppo, Vivo, Motorola, LG, Google, OnePlus, Sony, Tablet ... Với Rất Nhiều Tùy Chọn, Bạn Dễ Dàng Chọn Các Trò Chơi Hoặc Phần Mềm Phù Hợp Với Thiết Bị Của Bạn.
Nó Có Thể Có Ích Nếu Có Bất Kỳ Hạn Chế Quốc Gia Hoặc Bất Kỳ Hạn Chế Nào Từ Phía Thiết Bị Của Bạn Trên Google App Store.
Những Gì Mới
Bugs removed
Đánh Giá Và Xem Xét Trên Google Play Store
Tổng Số Cài Đặt (*Ước Tính)
Ước Tính Tổng Số Cài Đặt Trên Google Play, Xấp Xỉ Từ Số Lượng Xếp Hạng Và Giới Hạn Cài Đặt Đạt Được Trên Google Play.


Discover Apps

- Chatbot - AI Smart Assistant

- ChatOn - AI Chat Bot Assistant

- AI Chat - Assistant & Chatbot

- Truyền hình cho Chromecast

- Deep Think - AI Seek Chatbot

- Khoá Ứng Dụng - Khóa Vân Tay

- AI Chatbot: Pixi

- DeepSeek, ChatGPT - AskMyChat

- Perplexity - Ask Anything

- Inscope - AI Search & Browser

- AI Transcribe Speech to Text

- Vetted AI Smart Shopping Agent

Ứng Dụng Phổ Biến


Ứng Dụng Mới Phổ Biến
- Truyền hình cho Chromecast
- Deep Think - AI Seek Chatbot
- Perplexity - Ask Anything
- Grok
- Trình Đọc Tất Cả Tài Liệu

- Calendar Planner - Agenda App

- WPS Office-PDF,Word,Sheet,PPT
- Habitify - Theo dõi thói quen

- Adobe Acrobat Reader: Edit PDF

- All Language Translator App

- Claude by Anthropic

- Wifi Passwords - Wifi Analyzer
